Thursday, 18 April 2024 02:27 PM
OR
Login using

Data of the last 14 years show Nepal’s anticorruption efforts have impacted nothing. All anti-corruption efforts and investments have gone into waste.
It is 14 years since Nepal was first enlisted in Berlin-based anti-corruption agency Transparency International’s (TI) annual publication of global ranking on corruption perception index (CPI). Though the index was launched from 1995, Nepal was enlisted a decade later in 2004. With 14 years of data in hand and a new government in power with anticorruption agenda, it is an appropriate time to take a stock on how we have fared on global corruption perception.
The latest data, released on February 21, enlists a ranking for a total of 180 countries. With a score of 31 Nepal is ranked at 122nd position. Last year, Nepal scored 29 and was ranked at 131st position among the list of 176 countries. In South Asia, Nepal is ranked above Bangladesh (28) and Afghanistan (15). Bhutan continues to be at the top with a CPI score of 67 and ranked at 26th position.
Measuring corruption
Among the several measures of corruption, it will be fair to say that CPI is the most popular measure and it is often taken as the branded item of TI. Originally invented by Prof Johann Graf Lambsdorff from University of Passau, Germany, CPI is a subjective measure of perception of corruption (please note, not an objective measure) based on the opinion of the experts (usually foreigners) on how they perceive public sector corruption (again note, the word public sector, not the private sector). Since corruption is a clandestine activity, it can never be measured objectively. Therefore, what can be measured is subjective perception. Therefore, there is always a danger of perception not matching reality. However, the advocates of CPI say that with social problems like corruption, it is the perception or the belief that matters more than reality.
Over the last two decades, one can see a proliferation of governance measures reflecting a kind of knowledge explosion. There are now wide varieties of subjective and objective, positive and negative, demand side and supply side, inputs based and output based, aggregated and dis-aggregated measures. There are measures of corruption in the field of public procurement, mining and extractive industries, army, judiciary, public service delivery and in specialized areas like money laundering, policy capture, nepotism, revolving door, and financial integrity. Besides the CPI, TI has half a dozen other measures of corruption. But the CPI is the most popular one.
The CPI index measures corruption perception in a range of 0 to 100 scale (prior to 2012, this was from 0-10). Higher scores imply cleaner countries and low scores mean corrupt countries. Little aware about CPI technicalities, often Nepali media misinterpret CPI scores. One misinterpretation this scribe has observed is the reading the data bottom-up instead of conventional international practice of reading top-down. The other mistake is to take CPI value as an absolute measure of increase or decrease of corruption. There is also confusion between ranking and scores. Here are some rules of thumb for a naïve reporters on CPI. First, countries scoring below 30 is taken as corruption rampant countries. Second, earlier CPI data from one year to other were not comparable unless data sources are the same. However, from 2012 onwards, TI maintains that CPI data are comparable. The rule of thumb here is that any change in +/- 3 in CPI score is regarded as statistically significant. Third, it is better to look at CPI score of the country rather than its ranking. Country’s ranking may change due to inclusion or exclusion of countries from the list. Fourth, reliability of the published data is as much important as the CPI score and ranking. This can be gleamed from the confidence interval and the number of surveys used for constructing CPI. Finally, CPI is often called “poll of polls” because the surveys are not organized by TI. It rather uses secondary information published by other international agencies. A country is eligible for CPI when there exist, at least, three surveys and such surveys should include multiple countries. The reason for not listing Nepal before 2004 was due to lack of required number of surveys.
Nepal and CPI
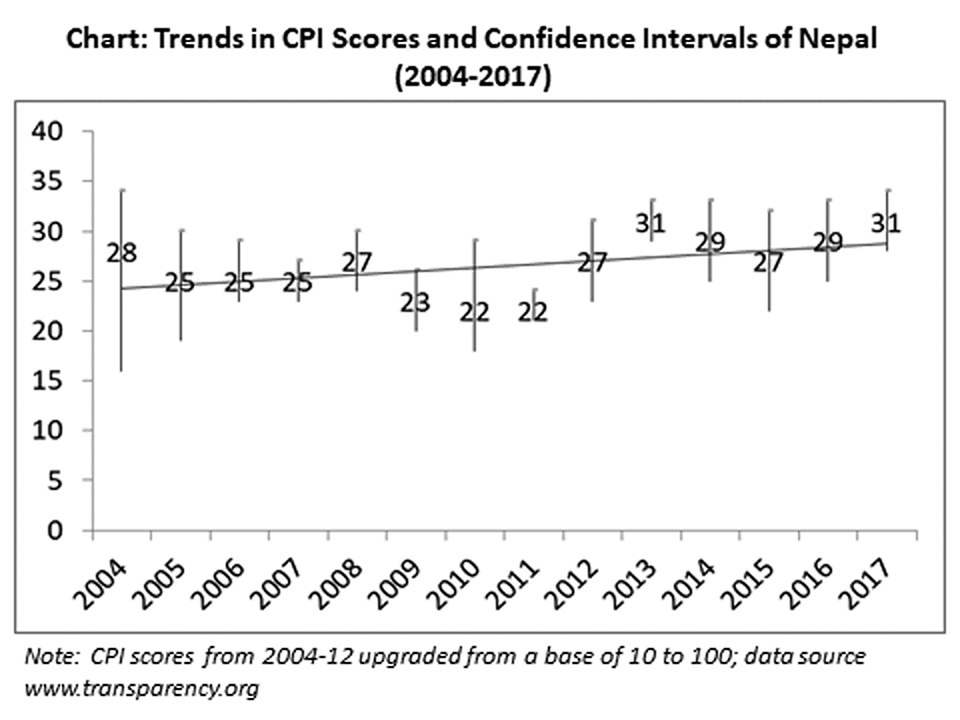
So what does the 14 years of corruption data publication speaks of Nepal? The chart in this article presents Nepal’s CPI scores from 2004-2017 with 90 percent confidence intervals. A simple trend line is also fitted in the chart for a clear picture on CPI movements. For a non-statistician reader, the things to look into the graph are not just the average CPI scores but also the length of the vertical line representing confidence intervals and their overlapping. The longer vertical lines imply lesser the reliability of the data compared to shorter lines.
Over the last 14 years, there are hardly any significant changes, positive and negative, in Nepal’s corruption perception. This is also reflected by a near flattening trend line. The published data ranges from a maximum of 31 (in 2013 and 2017) to a minimum of 22 (in 2010 and 2011) and Nepal’s ranking has varied from 90th position with 146 countries in 2004 to 154th position with 182 countries in 2011.
Going by the rule of thumb mentioned above, with CPI hovering around 30, Nepal is a corruption rampant country. A slight perceptible change can be observed in 2013 when Nepal scored 31 with a gain of four points over 2012. The vertical line is also smaller reflecting considerable reliability of the data. Paradoxically, the period coincided with the arrival of Lok Man Singh Karki in CIAA. Other interesting observation is that Nepal’s score dropped from 2004 to 2005, that too, at a time when the then royal government’s prime agenda was to fight corruption through an extra-constitutional body called Royal Commission for Corruption Control (RCCC). In the chart, one can observe ups and downs in CPI scores but these changes are insignificant. Similarly, one can observe variation in length of the vertical lines reflecting reliability of the data.
The only message that we get from a near stable data for last 14 years is that Nepal’s anticorruption efforts have impacted nothing. All those anticorruption efforts and investments, including that of the donors, have gone into waste. This is like draining water over sand. The foreigners continue to perceive us as a highly corrupt country. The call for increased foreign investment is meaningless unless we improve our image on governance and corruption. Also, the message we get from the trend in CPI scores is that we need not worry so much with the seriousness of the malady (corruption) as much with the ineffectiveness of the remedy (anticorruption measures) because we are already at the bottom of CPI scale.
Criticism and popularity
There is as much criticism against CPI as its popularity. Its inventor has disassociated from its publication since long time back. Taiwan and Malaysia disagree with publication results. Once there was a riot in Bangladesh against CPI publication when it was placed at the bottom of the scale. Now, TI Chapter in Bangladesh boasts of having a largest chapter in the world. In 1997 when Kenya was delisted, due to lack of an adequate number of surveys, people joked about Kenya not having corruption problem. There is no less a sense of humor with the CPI publication. Pakistanis joke that they bribed Nigerians to take the bottom position. Coming back to our country, the then royal government in 2005, after finding a drop in CPI scores, issued a decree seeking to find out the agency responsible for bringing disrepute to the country.
In the global list of ranking, it is the top 20 and bottom 20 that really matter for media people. The Scandinavian countries have nearly monopolized the top 20 results while poor, conflict-affected, fragile countries are always pushed down at the bottom 20. There are not more than half a dozen countries which have substantially improved their ranking. With two-third countries scoring less than 50 (global average is 43), this year TI calls “little or no progress at all” in our efforts to fight corruption.
You May Like This

Aren’t they worth it?
After 10 hours of tiring bus ride from the capital city to Dhap, I could finally afford to rest my... Read More...

EU Election Observation Report reflects reality: NEFIN
KATHMANDU, March 23: While criticizing the statements made by top leaders of major political parties, Nepal Federation of Indigenous Nationalities (NEFIN)... Read More...
Investors' perception toward Nepal has changed
Nabindra Raj Joshi, who was the deputy mayor of Kathmandu Metropolitan City after the democratic movement of 1990, is the... Read More...


Just In
- Morang DAO imposes ban on rallies, gatherings and demonstrations
- Gold smuggling case: INTERPOL issues diffusion notice against accused fugitive Jiban Chalaune
- Raya appointed as Auditor General
- 9 are facing charges in what police in Canada say is the biggest gold theft in the country’s history
- Gold price falls by Rs 600 per tola
- Dr Anjan Shakya nominated as National Assembly member
- Special session of Koshi Province Assembly begins
- Lumbini Province: Three UML, one NUP leaders to take oath as ministers without portfolio today
Leave A Comment